


SR System - Refresher Course
Our experience has shown that the majority of our students do not apply the SR System rules and it's Checklist prodedures correctly after attending the Winning Strategies & Systems Course. Therefore, we have deemed it necessary to create this Refresher Course where students can review the different steps and rules as many times as they would require to become proficient in trading this system, and hopefully in time achieve the high profitability that this system offers.
This site will also give us the opportunity to launch the latest improvements to the system as well as the newest versions of the indicators we use. The reader is welcome to give us any feedback that will help us improve the effectiveness of this material.
Setup & Checklist:
Please use the resources at the top of the page (THE SETUP & CHECKLIST) to make sure you have the latest indicators and template installed, as well as having the latest trading Checklist, before starting to use the training material that follows. Then:
- Create the charts you want to trade with the correct / latest indicators and template
- Draw the Support & Resistance levels and ensure that they are approximately 50% of the ADR (in distance of pips) between each other
- Mark important News Releases with vertical lines on the charts you are trading and avoid being in the market when they happen
- Open the Data Window on the side bar for accurate determination of crossings, etc.
The SR System consists out of Three Phases, i.e.
FIRST PHASE: Alert Signals are sent out indicating a possible BUY or SELL, while naming the currency pair and time frame.SECOND PHASE: Trader checks if the rules on the Checklist are complied with to confirm the trade and determine the Price level which will trigger the trade.
THIRD PHASE: Trader activates the OpenTradeSR Expert Advisor after entering the specific selections and Price level - or opens trade manually when price breaks previous high or low Price level.
FIRST PHASE:
ALERT SIGNALS (Compliance To The First Four Items On The Checklist):
One of the free services we offer is to scan all the charts for possible trades, and if the first basic rules of the Checklist is complied with, we send out alert signals to warn of possible trades that can be taken by the trader after further confirmation. These signals are sent when the following criteria have been met:
- The Stochastic Oscillator has either crossed the 80 level from above (possible SELL) or the 25 level from below (possible BUY) OR
- There was a currency crossing on the CurrencySlopeStrength indicator AND
- Both NonLagMA's are pointing the same direction as crossings (both Bullish or both Bearish) AND
- The TMASlopeMTF indicator for the H4 time frame must be above the MA and the MA slanting upwards for Bullish trades or below the MA and the MA slanting downwards for Bearish trades.
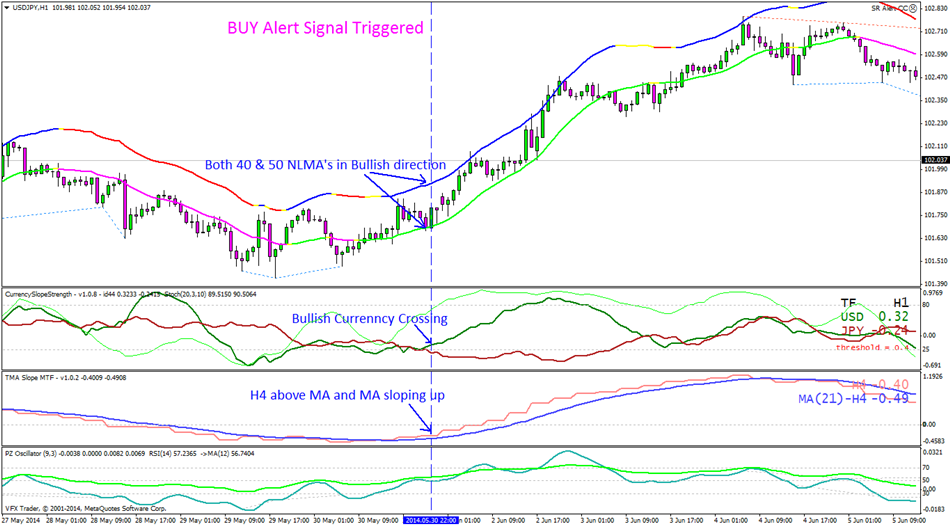
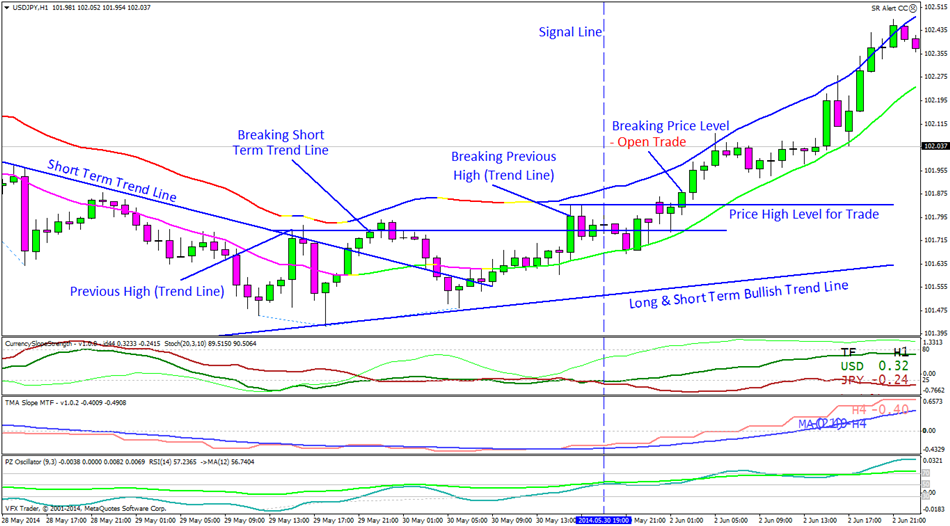
Below is a chart illustrating the situation when the abovementioned criteria are met and a BUY alert signal sent out by e-mail.
The signal will look something like this:
BUY USDJPY Timeframe = 60; Date = 2014.05.30; Time = 22:00; GMT = +3
SECOND PHASE:
TRADER CHECKS COMPLIANCE TO CHECKLIST AND DETERMINES ENTRY PRICE LEVEL:
Here follows step by step the next items on the Checklist that the trader must check for compliance: If any of these items are not complied with the trade is abandoned.
ITEM 5: Suitable Volatility (and Momentum)?
Ideal trading market conditions:

Market Conditions to be Avoided:
N.B. Volatility is more important than Momentum (although still important), since the Momentum can change quickly into something more positive.
If the market shows acceptable volatiltity (and momentum) you can continue to the next Item on the Checklist.
ITEM 6: Trade in direction of current (e.g. H1) and higher time frame (e.g. H4) trends !
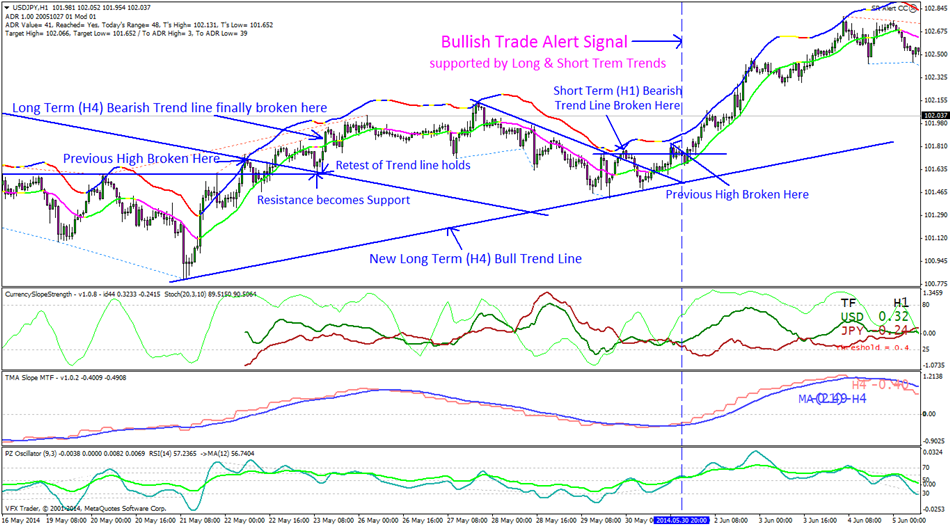
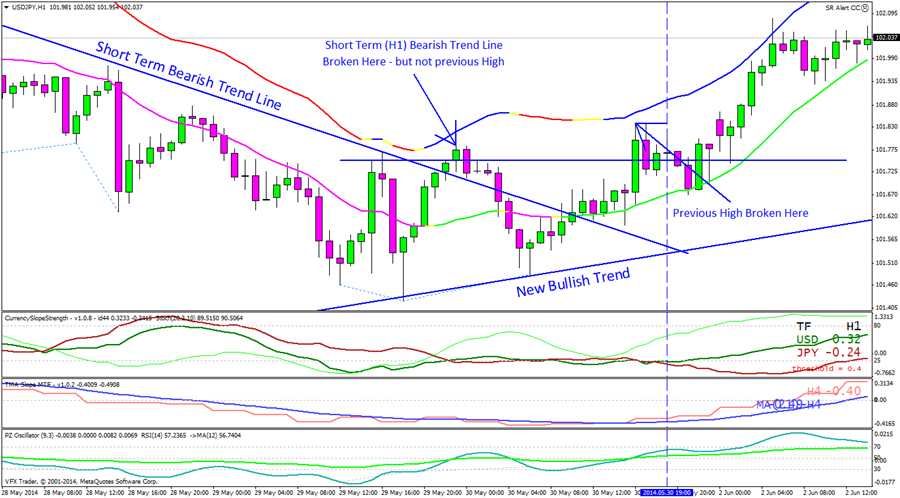
This is a critical item and must ALWAYS be applied. Below is an example of how the Long Term (e.g. H4) and Short Term (e.g. H1) trendlines supported the Bullish trade signal on our USDJPY example.
NOTE: Please note how the price/candlesticks must "break" (according to our breaking rule - see item on the bottom of this page expanding on this) not only the Trend line itself, but also the previous High (Low - in case of Bull trend), before it is accepted that the trend is now finally reversing from Bear to Bull (or from Bull to Bear)
Here is the example:
Here is some more detail on the above chart:
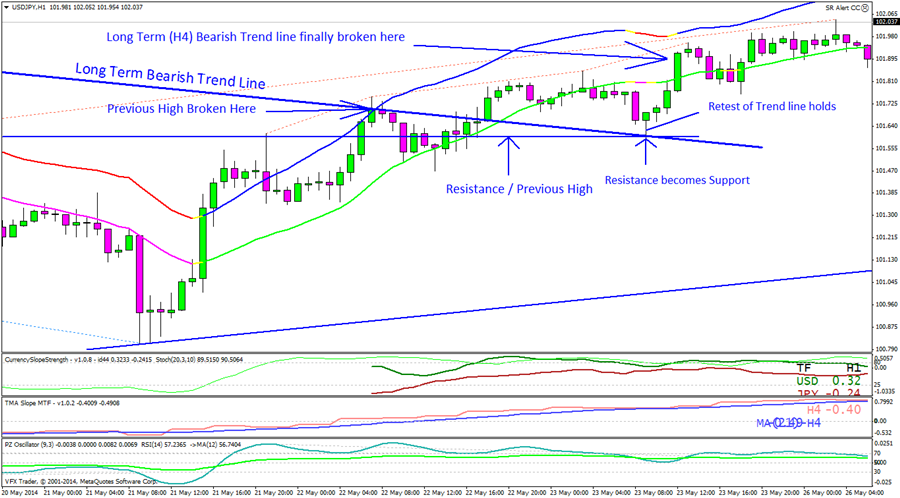
And here...
For those of you that struggle with drawing the correct trend lines I have added the TMA Slope MTF indicator to give some assistance. Apply the following rules:
- For a BUY transaction on the H1 time frame: The H4 line on the indicator (usually pink) must be above the MA (blue) line and the MA must at least be slightly sloping up a little. (Use your Data Window to ascertain this - if it cannot be visually determined)
- For a SELL transaction on the H1 time frame: The H4 line on the indicator (usually pink) must be below the MA (blue) line and the MA must at least be slightly sloping down a little.
N.B. The TMA Slope MTF indicator actually shows the trend that relates more to the lower time frame (e.g. H1) even when set on the higher time frame (e.g. H4)
ITEM 7: Divergences?
Next the trader must establish if there are any divergences pointing to price movements in the opposite direction of the intended trade.
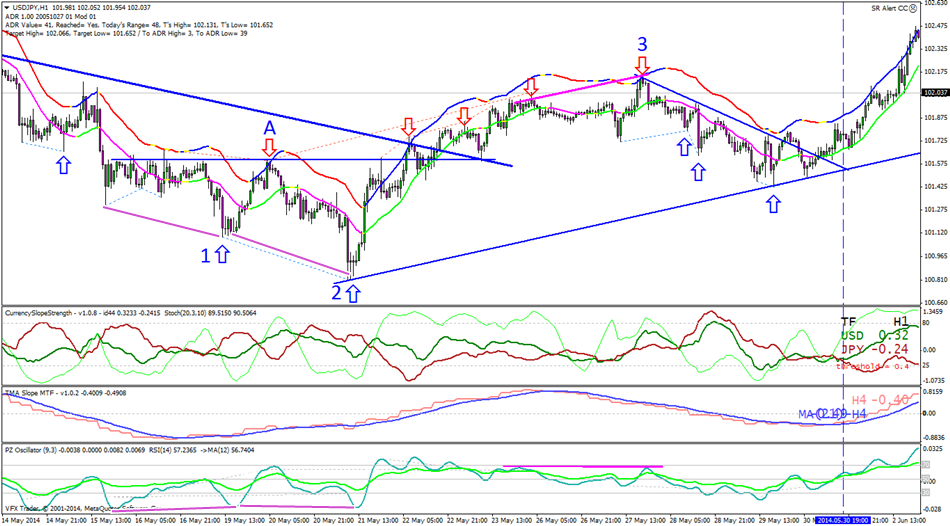
Here we use a new indicator that is based on the MACD and is called PZ Oscillator. There are no very reliable divergence indicators available on the market, because of the difficulty to program the specific conditions. This indicator does in fact contribute some value by indicating many of the smaller "hidden" divergences that show minor movements, but it does miss some of the more major divergences that can be detected by visual means. The next chart shows the combination of divergences marked by the indicator and those major ones detected by visual means:
 .
.
The chart shows 3 major divergences than can be visually detected. i.e. 1, 2 and 3 of which only 2 was also indicated by the indicator. The indicator did show many other minor divergences, which would have been very helpful in showing retracements/corrections in a trend , and delaying a trade until the price moves again in the right direction for a better entry.
The bearish divergence indicated at position "A" is a very strong signal because it is in the direction of the main trend, as well as after an unsuccessful attempt to break the previous high/resistance level.
In this case there are no divergences showing a possible bearish movement so the BUY trade stands.
ITEM 8: RsiMA (the Lime Green line) at or below 30 (NO Sell's) - or at or above 70 (NO Buy's)?
This step is not very critical and can be skipped without serious detrimental effect on profitability. Nevertheless, for those more advanced traders that use scaling in during a trend this can be valuable in indicating when the trend is overbought or oversold and a correcttion could be expected. So if this indicator is at or above the 70 level the price is overbought and NO BUY trades are recommended, and when it is at or lower than the 30 level the price is oversold and NO SELL trades are recommended.
Here are some examples:
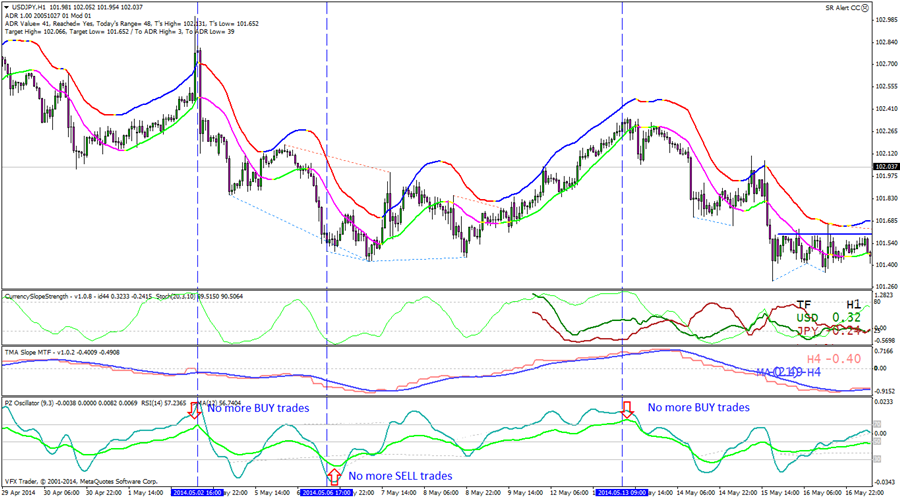
In our current trade USDJPY example the RsiMA is just over 50 and so the BUY trade is still valid.
ITEM 9: Long Bar or Series of bars in the same direction?
Price moves in cycles. Although long bars or a series of bars in the same direction ( e.g. 5 or more BULL or BEAR candlesticks in a row) can indicate a strong move that is likely to continue, there often could be some correction or retracement before the price continues - and sometimes it can even reverse. Therefore, it is prudent to first wait and see if there is a correction, and only if the price continues in the same direction is a trade is confirmed. (It is hoped that our price level "breaking rule", before the trade can be opened, will save us from some of these tricky situations.)
N.B. On the other hand, this situation could also present us with an an opportunity to get in at a better price on the turning point of a retracement.
Here are some examples:
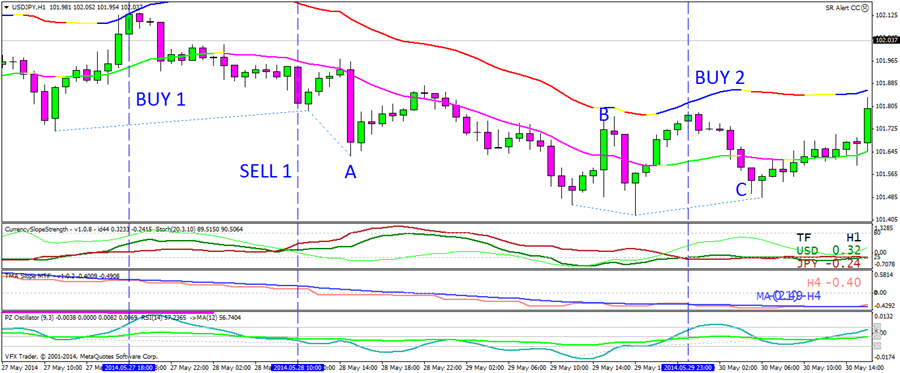
BUY 1: Here we have 7-8 bars of which only one bar is not a Bullish bar. As can be seen there was reversal that took place at that point.
SELL 1: In this case we have a longish bar - not really qualifying for a long bar, but even here we find a correction of 4 Bullish bars.
"A": This is a very good example of a long bar - and we are not surprised to see quite a substantial correction before the price moved on.
"B": Three consecutive Bullish bars - one quite long - and a strong correction.
BUY 2: Six consecutive Bullish bars with an expected correction.
"C": Five Bearish bars in a row (with one Doji) and a reversal follows.
To have jumped in prematurely in opening a BUY trade at BUY 1 and BUY 2 before waiting for the correction, would not have been wise.
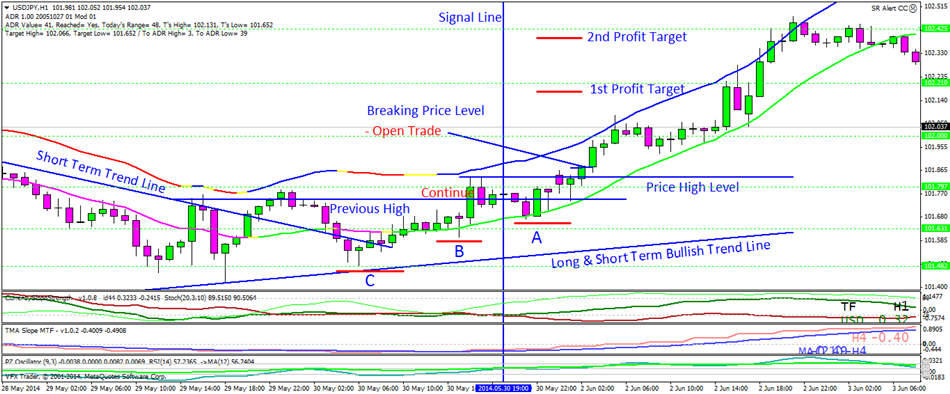
ITEM 10: Establish Previous High / Low Price level that must be "broken" by the Price before trade is opened
This rule plays a critical role in the success of the system. Ensure that you know how to differentiate between the "breaking" of the trend line and the the "breaking" of the previous high / low Price trade level. (They can sometimes coincide and be the same)
Please study our USDJPY setup on the following chart to see how it is done: (Look at the "Breaking Rule" section to see more detail as well as some other options)
The result of applying this rule should be the "Price High Level for Trade" as indicated on the chart. (Of course, if it was a SELL trade we have to find the "Price Low Level for Trade)
ITEM 11: Risk:Reward must be at least 1:1 (with few exceptions as indicated under the section "Best Practice")
To determine the viable Risk:Reward for a possible trade we must first find the optimal Stop Loss (RISK) position. This can be quite an art and may take long experience before perfected. We go back to our trade setup on our USDJPY chart to find the best Stop Loss position. On this chart we have marked three possible Stop Loss positions based on the nearest "swing lows" as follows:
A = 20 pips ; B = 30 pips ; C = 40 pips
Now we look at Volatility:
ADR (Average Daily Range) for USDJPY = 41 pips ; Day of week (Friday), but more importantly the Time of Day is 23h00 (GMT 0) therefore volatility expected to be high in the next 2 - 3 hours when this currency pair is traded during the Asian session. (See next chart)
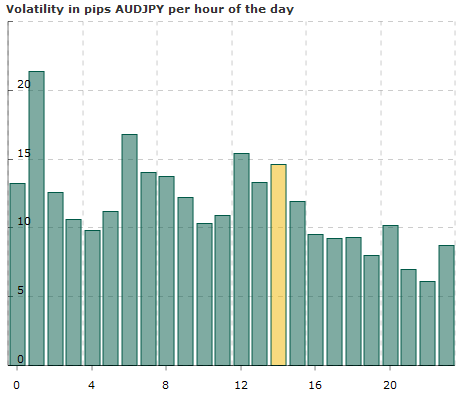
(Source: http://www.forexticket.com/en/tools/02-01-volatility)
Time frame is H1 where we would normally look for Stop Losses from 50 - 80 pips when trading in the London market time, but now that is not applicable, because it is 9 - 10 hours before the opening of the London market.
The Stop Loss at "A" (20 pips) is very low for the time frame we are trading, and it is also just above a SR level, where we would have preferred it to be just below the level, so we will not use this one.
N.B. REMEMBER IF YOU DECIDE TO TAKE SUCH A SMALL STOP LOSS YOU MUST SET A PROFIT TARGET WITH A RISK:REWARD OF AT LEAST 1:2
Now we are left with options "B" and "C".
The Stop Loss at "B", which is 30 pips away, sits at a not very strong "swing low" position, so we are not too happy with it. let's look further.
It is very clear that a Stop Loss at "C" (40 pips) should be very safe, it is at the limit of the ADR, at a strong swing low as well as below a SR level, but this places us at the limit of our ADR for our Take Profit target. (although ADR can sometimes be doubled or even tripled when certain news releases come out, or if a strong trend is in process) In this case we do have most of the ADR still available for the day. so if we place only half our maximum lot size on the opening of the trade this Stop Loss will be acceptable, since it will be at the same risk as opening the full lot size trade at the 20 pips Stop Loss. But we must move this Stop Loss manually as soon as the price moves in the right direction to improve our situation.
Furthermore, the two viable Profit targets are sitting at 30 and 50 pips (see next section), so if we take half profit at 30 and the other half at 50 we still have a 1:1 Risk:Reward.
As it happened in this case the price moved immediately in the right direction, so we could open the other half lot size trade immediately, and then also move the Stop Loss to position "A".
Now we have to look at the Reward / Take Profit possibilities:
Here we use the SR levels as viable targets, and because this is a BUY transaction the target should be just before the SR level, since price may find it difficult to pierce that level.
The first SR level is too close (10 pips) so is ignored. Just before the second SR level we have a target of 30 pips - and that is acceptable so our (first) Take Profit will be placed there. The third SR level offers a target of 50 pips and we will use this second Take Profit target for our second half of our available lot size.
Remember as the price move in the right direction the stop losses must be moved to the next level
ITEM 12: Calculate Lot Size
Now that we have established the position of our Stop Loss we are ready to calculate the volume of this trade.
Let us say we have a $2000 account (or available free margin for trading), and we do not want to lose more than 2% of our equity on any trade - then our lot size in this instance will be:
We are prepared to lose maximum 2% x $2000 = $40.
If we hit our Stop Loss at 40 pips when trading one mini lot (0.1 volume) then we will lose 40 x $1 = $40. We are prepared to lose $40 so then our lot size will be:
40 (the max that we are prepared to lose on a trade) / 40 (what we will lose when we hit our Stop Loss trading 1 mini lot) x 0.1 (1 mini lot) = 0.1 (1 mini lot or 10 micro lots.)
We will open our trade with only half this amount (i.e. 0.05 or 5 micro lots) and only add the other half when the price moves in the right direction.
If we also do basket trading we will furthermore share this number of micro lots (plus maybe up to 50% more - depending on number of trades - because the risk in basket trading is much lower) among our 2 - 5 trades.
THIRD PHASE:
ITEM 13: Open trade with half the lot size when Price "breaks" the previously established high / low level.
This could be done manually when the "breaking rule" gives the confirmation for the trade. Sometimes this Price level "break" can take many many hours (e.g. more than 16 hours if the price move is during the Asian [overnight] market, where prices move very little), and you may want to set a limit on the number of hours this trade is still valid. You will have to watch the price action and make a decision based on that.
To get a more accurate entry in some instances you can go to a lower time frame, e.g. the M5 time frme and take the entry there.
If you do not want to do this manually, or do not have the time, you can make use of the OpenTradeSR Expert Advisor to open the first trade with half the lot size and then set a pending BUY stop to open the other half when the price moves in the right direction. (I am planning to add a function to send an e-mail when the trade is opened so that you can be notified to put in a pending trade.)
Here are the settings for the OpenTradeSR Expert Advisor.
PriceLevel; - Here you enter the price level that has to be broken e.g. 1.37215
TradeDirection = 0; - For a BUY enter 0, for a SELL enter 1
ClosePips = 5; - the min number of pips required for the close above/below price level
ContPips = 5; - the min number of pips for the price must be exceeding the high/low of the close bar mentioned above
TooLate = 50; - If the price exceeds this number of pips past the price level the trade is abandoned (in case of long spikes past the close bar)
NoHours = 10; - the number of hours you want the opening of the trade to be valid before abandoning it
Stoploss = 50; - self explanatory
Slippage = 3; - don't worry about this one
FixedLotSize = 0.1; - If you chose LotSizeMethod = 1 the volume you want to trade
LotSizeMethod = 2; - FixedLotSize = 1, CapitalRisk = 2
EquityPercent = 2; If you chose FixedLotSize = 2 the % of equity you want to trade
StopLoss = 50; Set your StopLoss here. If TrendClose = True the trade will be closes at change of trend even before reaching StopLoss
TakeProfit = 50; - If TrendClose = false then profit will be taken at so many pips
FilterShort = 0.0; - Leave as is
FilterLong = 0.0; - Leave as is
TrendClose = true; Set to "True" if you want to close trade when 40 NLMA changes colour
LengthLong = 50; - Leave as is
LengthShort = 40; - Leave as is
PriceModeLong = 0; //0-Close;1-Open;2-High;3-Low;4-Median price;5-Typical price;6-Weighted Close - Ignore
PriceModeShort = 0; //0-Close;1-Open;2-High;3-Low;4-Median price;5-Typical price;6-Weighted Close - Ignore
MagicNumber = 1111; - Leave as is
ITEM 14: Take Profit recommendations
Take the first profit from the first half lot size at the first Profit Target that normally gives a 1:1 Risk:Reward, except
- when the Stop Loss is very small (e.g. 20 pips) and we go for a Risk:Reward of 1:2.
- when you use a Take Profit target that is equal or more than the ADR when it will be better to take profit for both trades at the first Profit Target
Take the second half lot size at the second Profit Target - or at the change of trend direction as indicated by the 40 NLMA indicator.
ITEM 15: Move StopLoss as Trade goes in positive direction.
As the price moves in a position of profit the Stop Loss must be moved first to a breakeven position and then to a profit position.
E.g. in our USDJPY trade example the StopLoss at "B" can be moved to breakeven point (the price at the opening of the trade) when the price reaches the first SR level and then to the first SR level when the price hits the 1st Profit Target, and so on.
Here is an example of a trade over two videos which I did in the simulator to show how I make decisions to trade or not:
Here is the second part of the video to show that the price actually hit the Take Profit target: